Empagliflozin Pharmacokinetics: Why Blood Levels and Glucose Effects Diverge
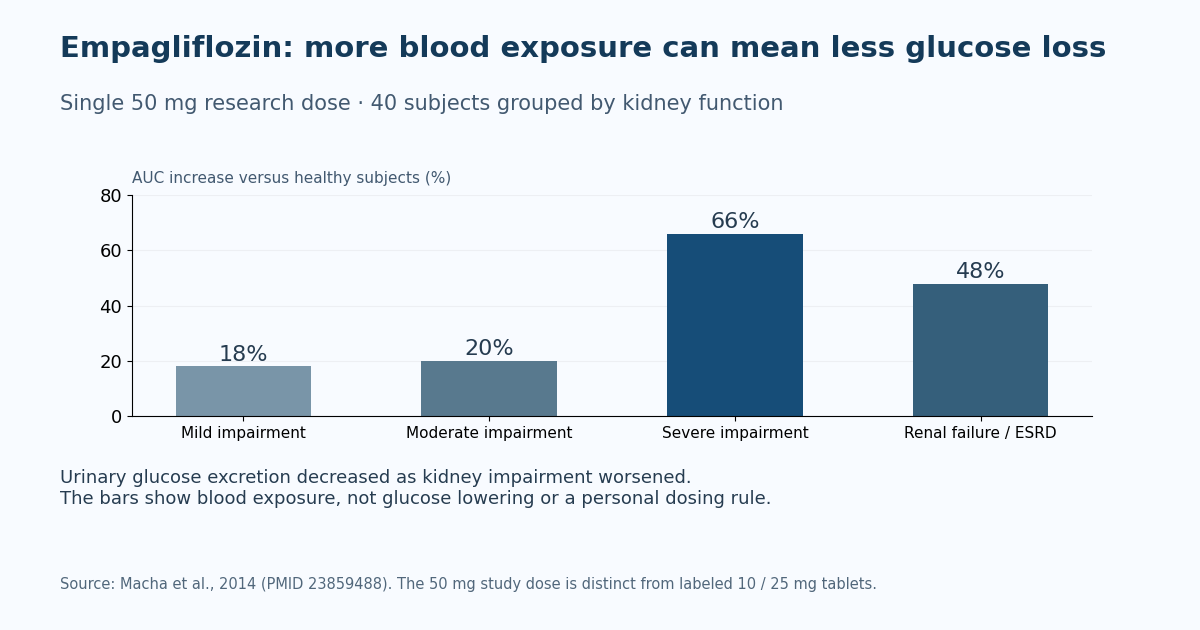
Empagliflozin concentrations in blood and its glucose-lowering effect can move in opposite directions. In a renal-impairment study, systemic exposure increased as kidney function worsened, while glucose excretion into urine declined. A higher blood concentration therefore does not necessarily mean a stronger glucose-lowering response. [4]
The distinction matters because pharmacokinetics, pharmacodynamics, and clinical outcomes answer different questions. Pharmacokinetics describes drug exposure over time. Pharmacodynamics describes a response to that exposure, such as urinary glucose excretion. Clinical trials determine whether treatment changes outcomes such as kidney disease progression. Results from one category cannot substitute for evidence from another. [2–4,6]
Why more drug in blood can mean less glucose in urine
Empagliflozin inhibits SGLT2, a transporter involved in reclaiming filtered glucose in the kidney. Laboratory experiments established potent inhibition of human SGLT2, but a transporter assay alone cannot describe the response of a kidney with reduced filtration. [5]
Glucose must first enter the kidney's filtrate before blocking its reabsorption can increase urinary glucose loss. With declining filtration, less glucose is available through this route. Meanwhile, changes in drug disposition can increase plasma exposure. These are separate processes: blood exposure reflects the drug's handling, whereas urinary glucose excretion also depends on the kidney's capacity to filter glucose. [4]
Macha and colleagues studied 40 subjects receiving a single 50 mg dose. Relative to healthy controls, exposure measured as area under the concentration–time curve, or AUC, rose by 18% with mild renal impairment, 20% with moderate impairment, 66% with severe impairment, and 48% with renal failure/end-stage renal disease. Urinary glucose excretion declined with worsening renal function. The 50 mg dose was an experimental regimen, not a current prescription regimen. [4]
This finding explains an apparent paradox, not an individual dosing rule. Nor does it establish clinical eligibility for dialysis treatment or quantify long-term kidney protection. [4,6]
What the measurements actually tell us
| Measured quantity | Population or design | Meaning and limits |
|---|---|---|
| Plasma AUC | Single-dose renal-function study | Summarizes systemic exposure; an increase need not produce more urinary glucose loss. [4] |
| Apparent oral clearance: 9.87 L/hour | Population model pooling 974 adults with type 2 diabetes | A fitted model parameter, not a directly measured clearance value for every person. [3] |
| Central/peripheral volumes: 3.02/60.4 L | Two-compartment population model | Mathematical descriptions of concentration patterns, not literal anatomical compartments. [3] |
| Day 1 urinary glucose changes: 74, 90, and 81 g | 10, 25, and 100 mg groups in a 28-day study | Changes from baseline demonstrate an early response, not dose-linear glucose loss or immediate clinical protection. [2] |
| Kidney progression or cardiovascular death | Randomized EMPA-KIDNEY trial | A clinical endpoint assessed over follow-up, rather than inferred from plasma concentrations. [6] |
The Riggs population analysis combined five placebo-controlled trials using 1–100 mg daily for up to 12 weeks. Its two-compartment model included delayed first-order absorption and first-order elimination. Such models summarize observed concentration patterns and estimate variability; their parameters depend on the dataset and model structure. [3]
The model's clearance and compartment estimates differ from those reported in the prescribing information. These should not be blended into one supposedly universal set of values. Body weight was the largest model covariate, but the analysis did not support exposure-based dose adjustment within its studied population. [1,3]
Early glucose loss is not an early outcome guarantee
In the 28-day Heise study, 78 people with type 2 diabetes received 10, 25, or 100 mg, or placebo. Exposure increased proportionally across the tested dose range, whereas urinary glucose response did not follow the same proportional pattern. The 100 mg arm was a research dose. Glucose excretion increased on Day 1 and remained increased during treatment. [2]
That early response does not establish a same-day HbA1c change or a same-day reduction in cardiovascular or kidney events. HbA1c and event-based outcomes require their own observation periods and evidence. The study's changes from baseline also should not be treated as interchangeable with daily urinary glucose averages reported elsewhere. [2,6]
EMPA-KIDNEY randomized 6,609 participants to empagliflozin 10 mg daily or placebo. Enrollment included eGFR 20 to below 45, or eGFR 45 to below 90 with urinary albumin-to-creatinine ratio at least 200 mg/g. Over a median two years, kidney disease progression or cardiovascular death occurred in 13.1% versus 16.9%, respectively; the hazard ratio was 0.72 (95% CI 0.64–0.82). Results were consistent in participants with and without diabetes. [6]
These outcome data show why reduced glucose-lowering activity should not automatically be interpreted as absence of kidney benefit. They also do not justify extrapolating trial results to every kidney-function level or to new treatment initiation on dialysis. [4,6]
Reading exposure without overinterpreting it
A plasma half-life, an apparent clearance estimate, and urinary glucose excretion are not interchangeable clocks. None supplies a personal time at which every drug effect has ended. Similarly, oral clearance is termed “apparent” because oral concentration data do not independently establish absolute bioavailability. Recovered radioactive material answers a different question from how much unchanged drug reaches systemic circulation. [1,3]
The useful reading order is therefore: identify what was measured, check the population and dose, and ask whether the claim concerns exposure, a physiological response, or a clinical endpoint. This keeps a laboratory potency result from becoming a safety claim and a renal exposure result from becoming an unsupported dosing instruction. [3–6]
Frequently asked questions
What is the half-life of empagliflozin (Jardiance)?
The model-derived apparent terminal half-life is 12.4 hours; healthy-subject urinary glucose excretion approached baseline around three days after one dose—not a personal clearance clock. [1]
How is empagliflozin metabolized?
In-vitro data identify glucuronidation through UGT2B7, UGT1A3, UGT1A8 and UGT1A9 as the primary metabolic route. No major metabolite was identified in human plasma.[1]
Can you take Jardiance with food?
Yes, with or without food. A high-fat meal reduced 25 mg AUC 16% and peak concentration 37%, without clinical relevance. [1]
Does kidney disease affect Jardiance dosing?
The label does not recommend glycemic use below eGFR 30 mL/min/1.73m²; heart-failure and CKD indications have different evidence.[1] Kidney impairment can raise exposure while reducing urinary glucose response, so AUC alone cannot determine eligibility.[4]
What is the bioavailability of empagliflozin?
The label gives no absolute human bioavailability percentage; radiolabel recovery does not establish it. [1] Animal pharmacokinetics likewise cannot supply a human percentage. [5] Recovery tracks drug-related material, not simply unchanged drug entering blood.
Does Jardiance interact with metformin or insulin?
The label reports similar empagliflozin pharmacokinetics with and without metformin. Combining it with insulin or a sulfonylurea increases hypoglycemia risk, a clinical interaction that does not depend on a large concentration change.[1]
How quickly does Jardiance start working?
Increased urinary glucose excretion was observed on Day 1 in the 28-day study. That is an early pharmacodynamic response, not proof of immediate HbA1c improvement or cardiorenal protection. [2] Clinical kidney benefit was evaluated over years. [6]
Is empagliflozin removed by dialysis?
Removal by hemodialysis has not been studied. The efficacy and safety trials did not enroll adults with eGFR below 20 mL/min/1.73m² or on dialysis; some participants continued after later deterioration. Continuation does not establish a new-treatment initiation rule.[1]
What drugs interact with empagliflozin?
Diuretics increase volume-depletion risk; insulin/sulfonylureas increase hypoglycemia risk. Lithium levels may fall: monitor during initiation or dose changes. [1]
Does body weight affect Jardiance pharmacokinetics?
Yes. The population model estimated exposure differences of about ±30% across the observed 2.5th and 97.5th weight percentiles. No exposure-based adjustment was required within that study. This is not a milligram-per-kilogram formula or evidence for excluded populations. [3]
How selective is empagliflozin for SGLT2 vs. SGLT1?
Preclinical human-transporter assays showed preferential activity against SGLT2 over SGLT1, with SGLT2 IC50 of 3.1 nM.[5] That potency measurement describes an experimental system; it does not quantify clinical kidney benefit or safety.
Does liver disease affect Jardiance dosing?
The label permits use with hepatic impairment; that is not a universal individual adjustment rule. [1]
References
Sources checked October 14, 2026.
- DailyMed. JARDIANCE, empagliflozin tablets. Cardinal Health 107 repackaged record, updated February 17, 2026. Cited US label
- Heise T, Seewaldt-Becker E, Macha S, et al. Safety, tolerability, pharmacokinetics and pharmacodynamics following 4 weeks' treatment with empagliflozin once daily in patients with type 2 diabetes. 2013. Primary record
- Riggs MM, Staab A, Seman L, et al. Population pharmacokinetics of empagliflozin, a sodium glucose cotransporter 2 inhibitor, in patients with type 2 diabetes. 2013. Primary record
- Macha S, Mattheus M, Halabi A, et al. Pharmacokinetics, pharmacodynamics and safety of empagliflozin, a sodium glucose cotransporter 2 (SGLT2) inhibitor, in subjects with renal impairment. 2014. Primary record
- Grempler R, Thomas L, Eckhardt M, et al. Empagliflozin, a novel selective sodium glucose cotransporter-2 (SGLT-2) inhibitor: characterisation and comparison with other SGLT-2 inhibitors. 2012. Primary record
- The EMPA-KIDNEY Collaborative Group, Herrington WG, Staplin N, et al. Empagliflozin in Patients with Chronic Kidney Disease. 2023. Primary record